Using What-if analysis is performing Sensitivity analysis using excel on a set of data, where we want to see a range of possible outcomes based on certain changing parameter values. This analysis allows a decision maker to take more informed decisions.
There are three different tools available in Excel to perform what-if analysis: Scenarios, Data tables and Goal Seek. Of these, we will be looking at “Data Table” based What-If analysis in today’s article. We can perform a One Variable What-If Analysis, as well as Two Variable What-If Analysis. What this means is, that we get to see an outcome on the data set by changing a maximum of two variables, called decision variables. (Some people may call decision variable as an independent variable).
The key is that the outcome for which we are trying to perform a What-if analysis should be a formula containing the decision variable(s).
Let us see each of the above in action.
One Variable Data Table What-If Analysis
Let us take an example where we have a sample data set that consists of columns such as the Units sold, the Cost per unit, the Selling price per unit, the Variable cost, the Sale amount, the Fixed cost and finally the Net Profit. In our example, we will take the “Units sold” as our decision variable and we will perform a what-if analysis on the outcome which is the “Net Profit”.
Step 1
Lets put the data set as shown below.

Step 2
By changing the input value (aka the decision variable) which in our case is “Units Sold”, we will see how different inputs values will impact the results – the Sale Amount, the Variable Cost, and finally our main goal the Net Profit.
We will be setting up our input variable box, which will have certain arguments that will allow us to change the range of Units Sold, and this will allow the input range more flexibility. I will explain this in more detail once we have completed the scenario.

Step 3
In this step we have to setup the matrix of data table that we need. Lets understand how this matrix is built.
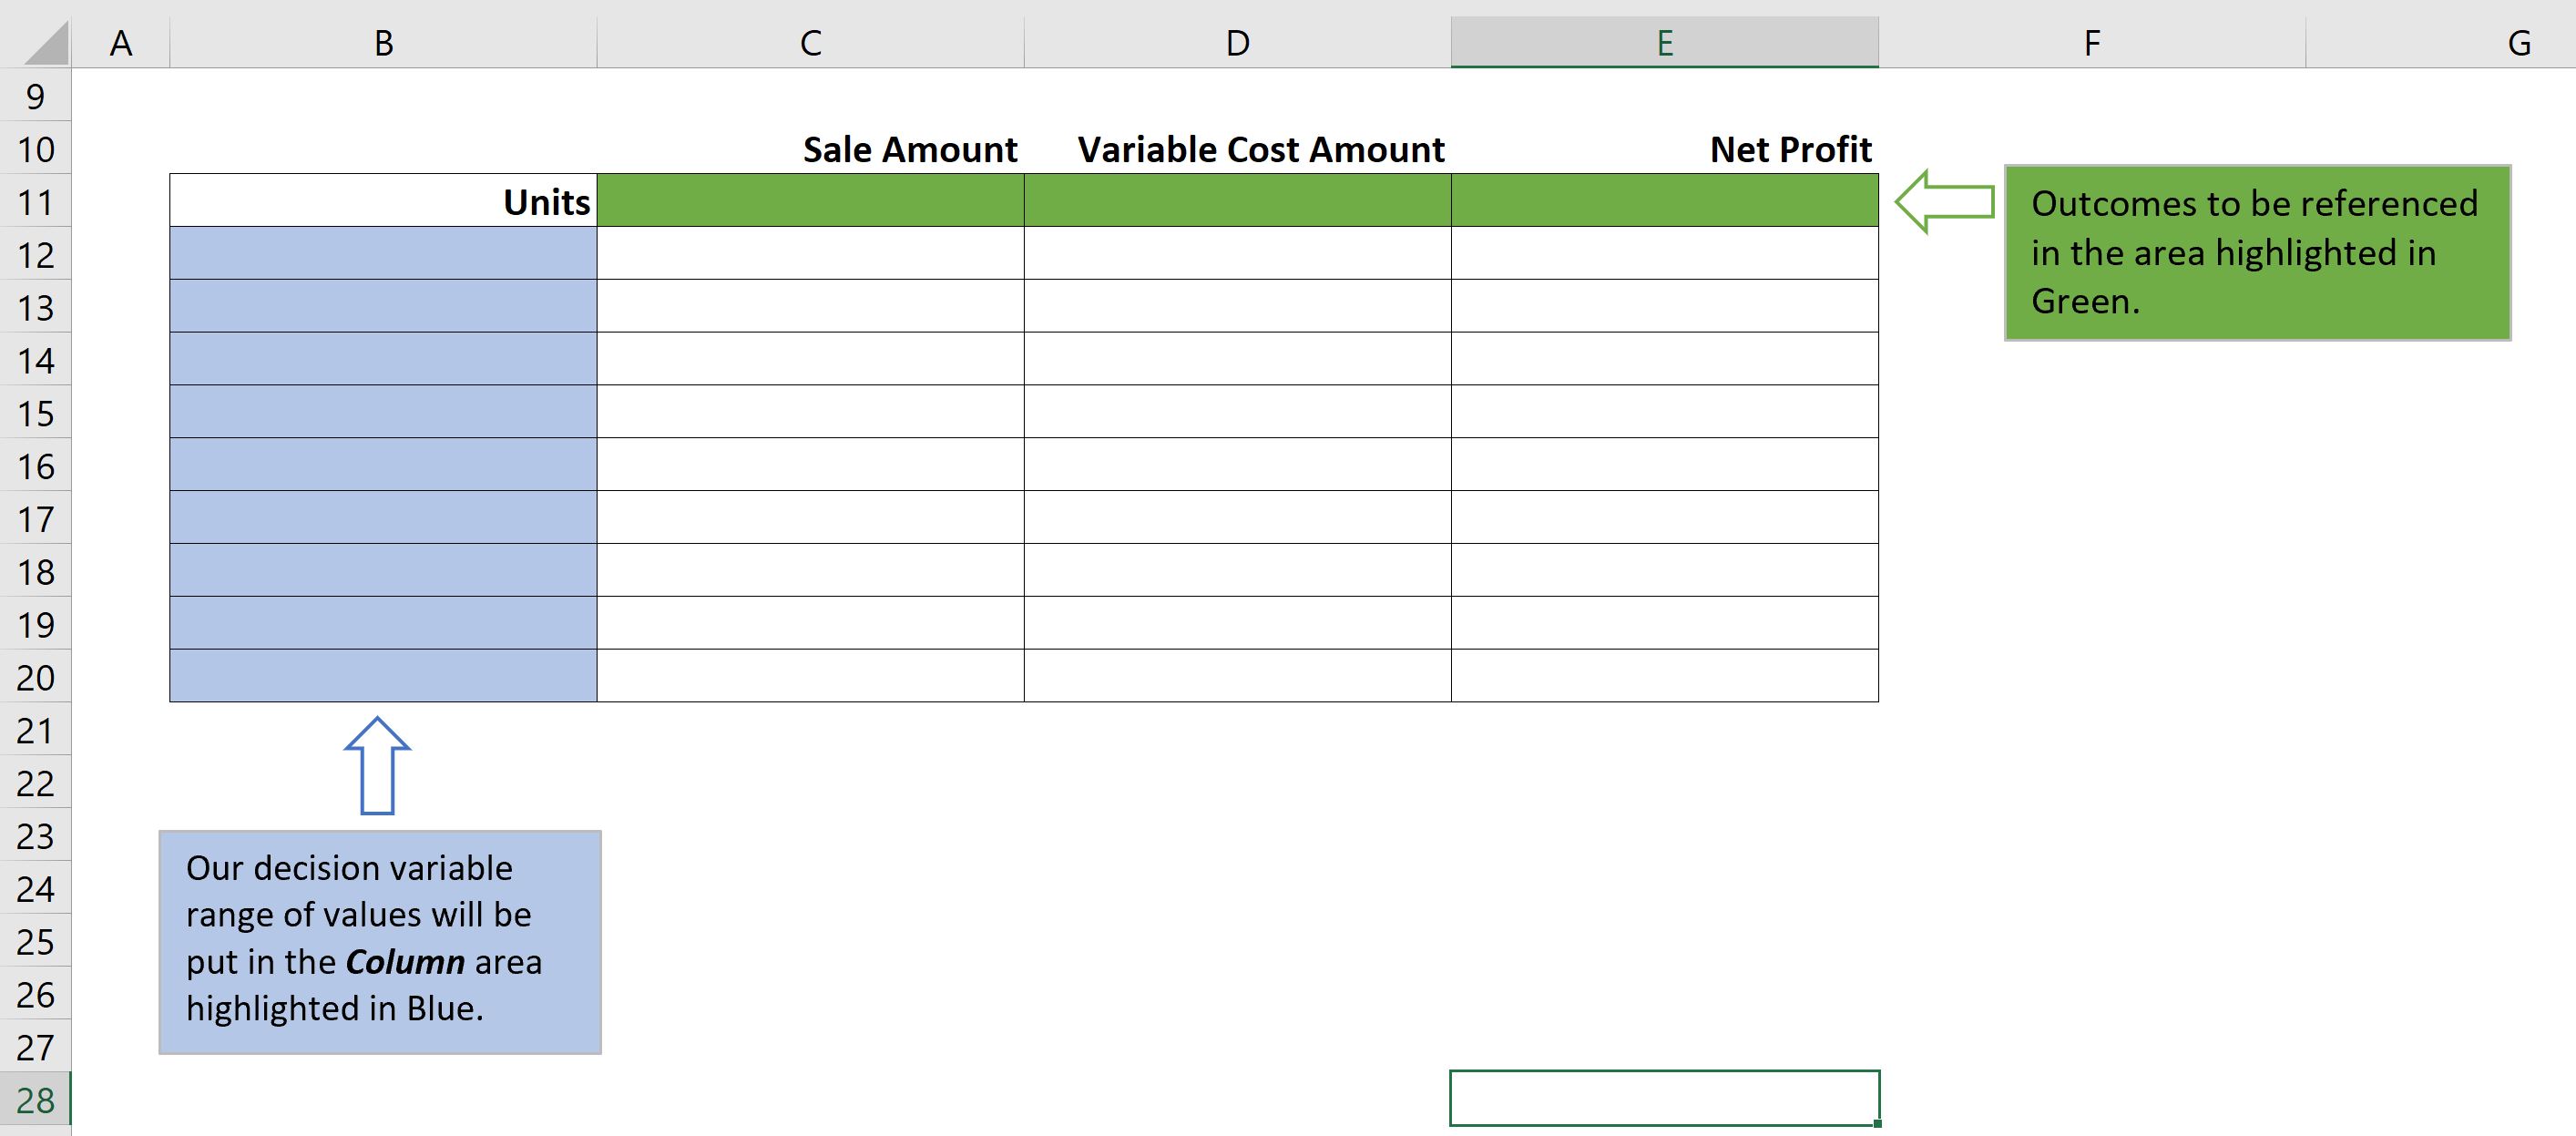
I have highlighted 2 areas in the matrix – Green and Blue. Green area is for the outcome, and the Blue area is for the decision variable range of values.
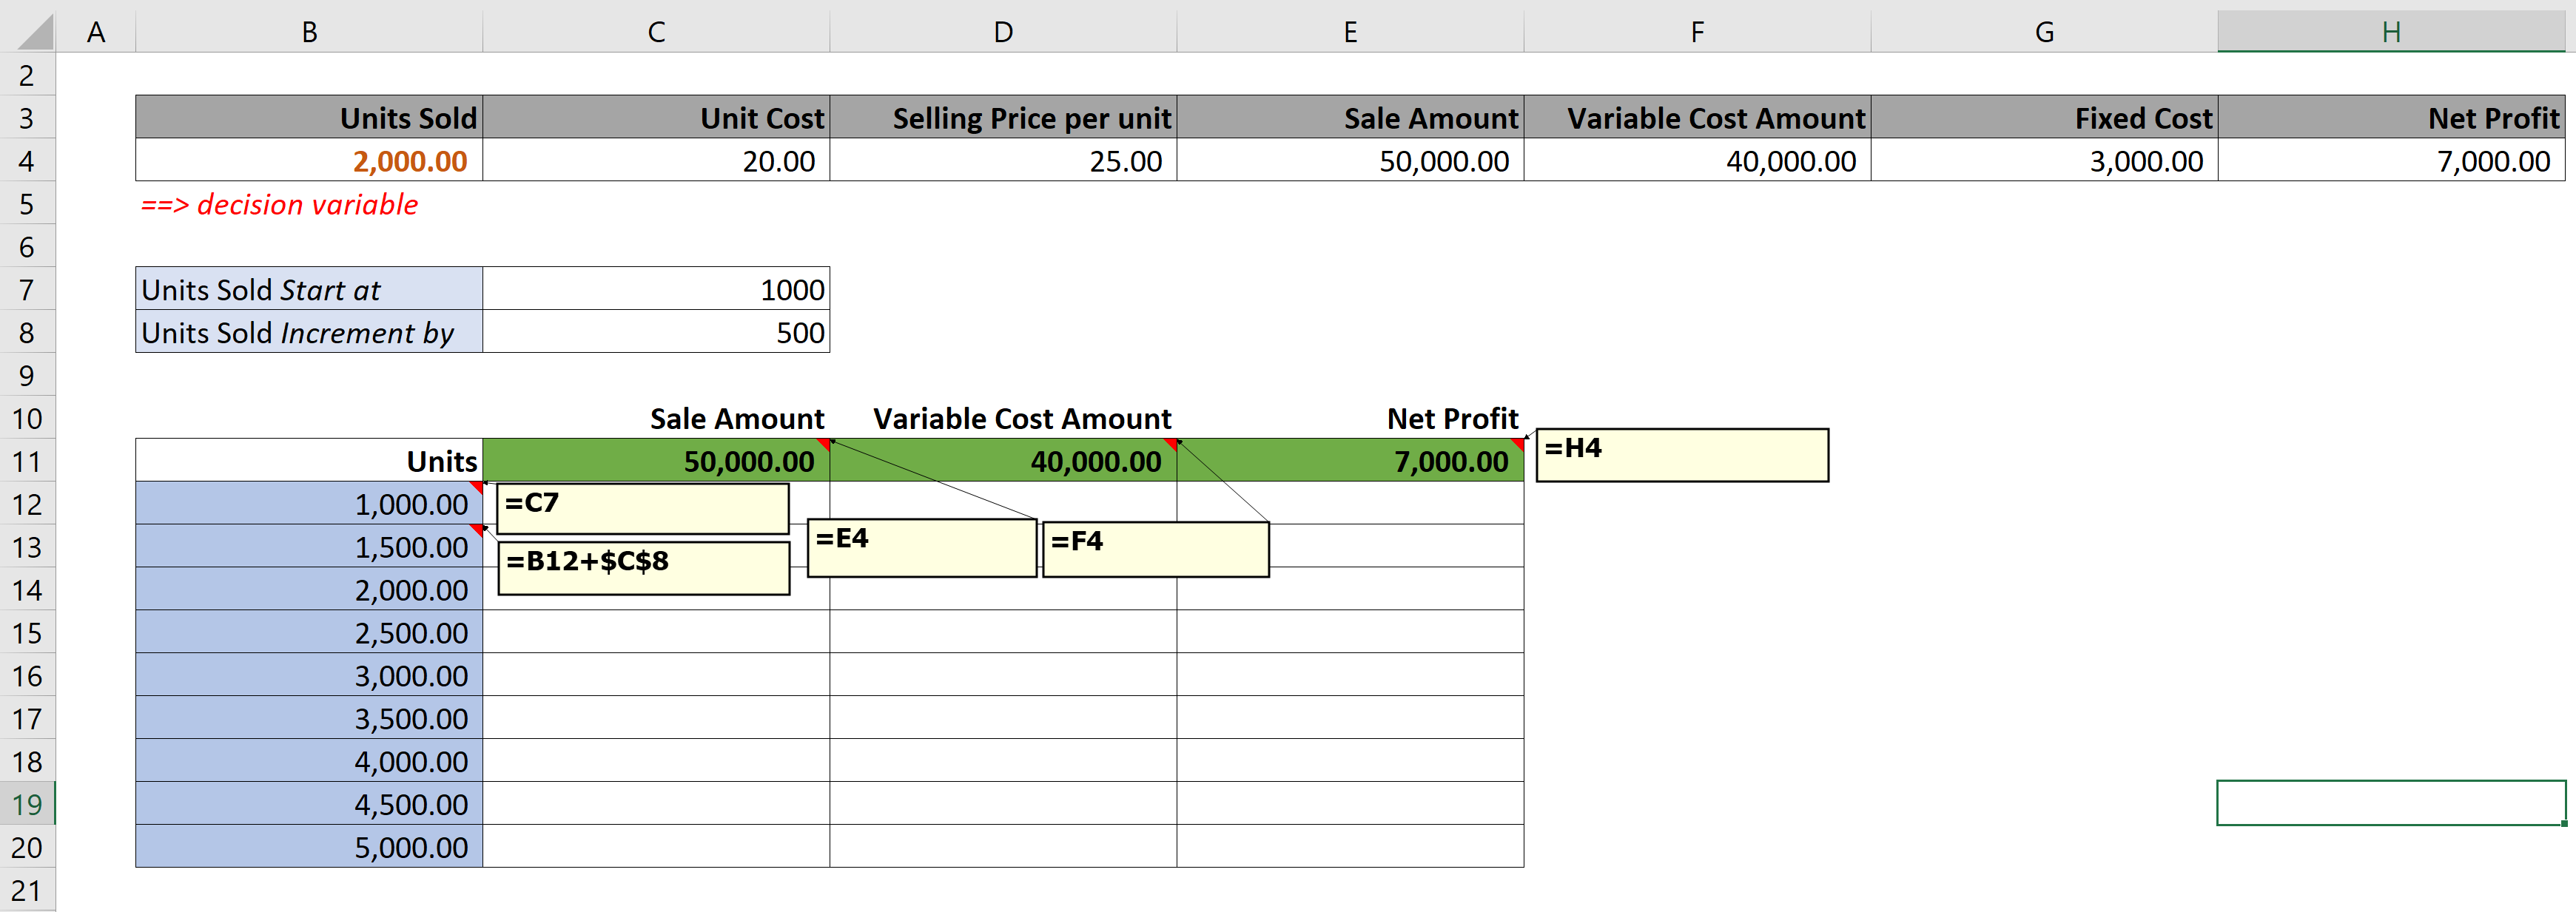
Input the formulas in the Green and Blue areas as shown below. This will help us build the Data Table for What-if analysis.
Step 4
Finally, we come to the creation of Data Table.
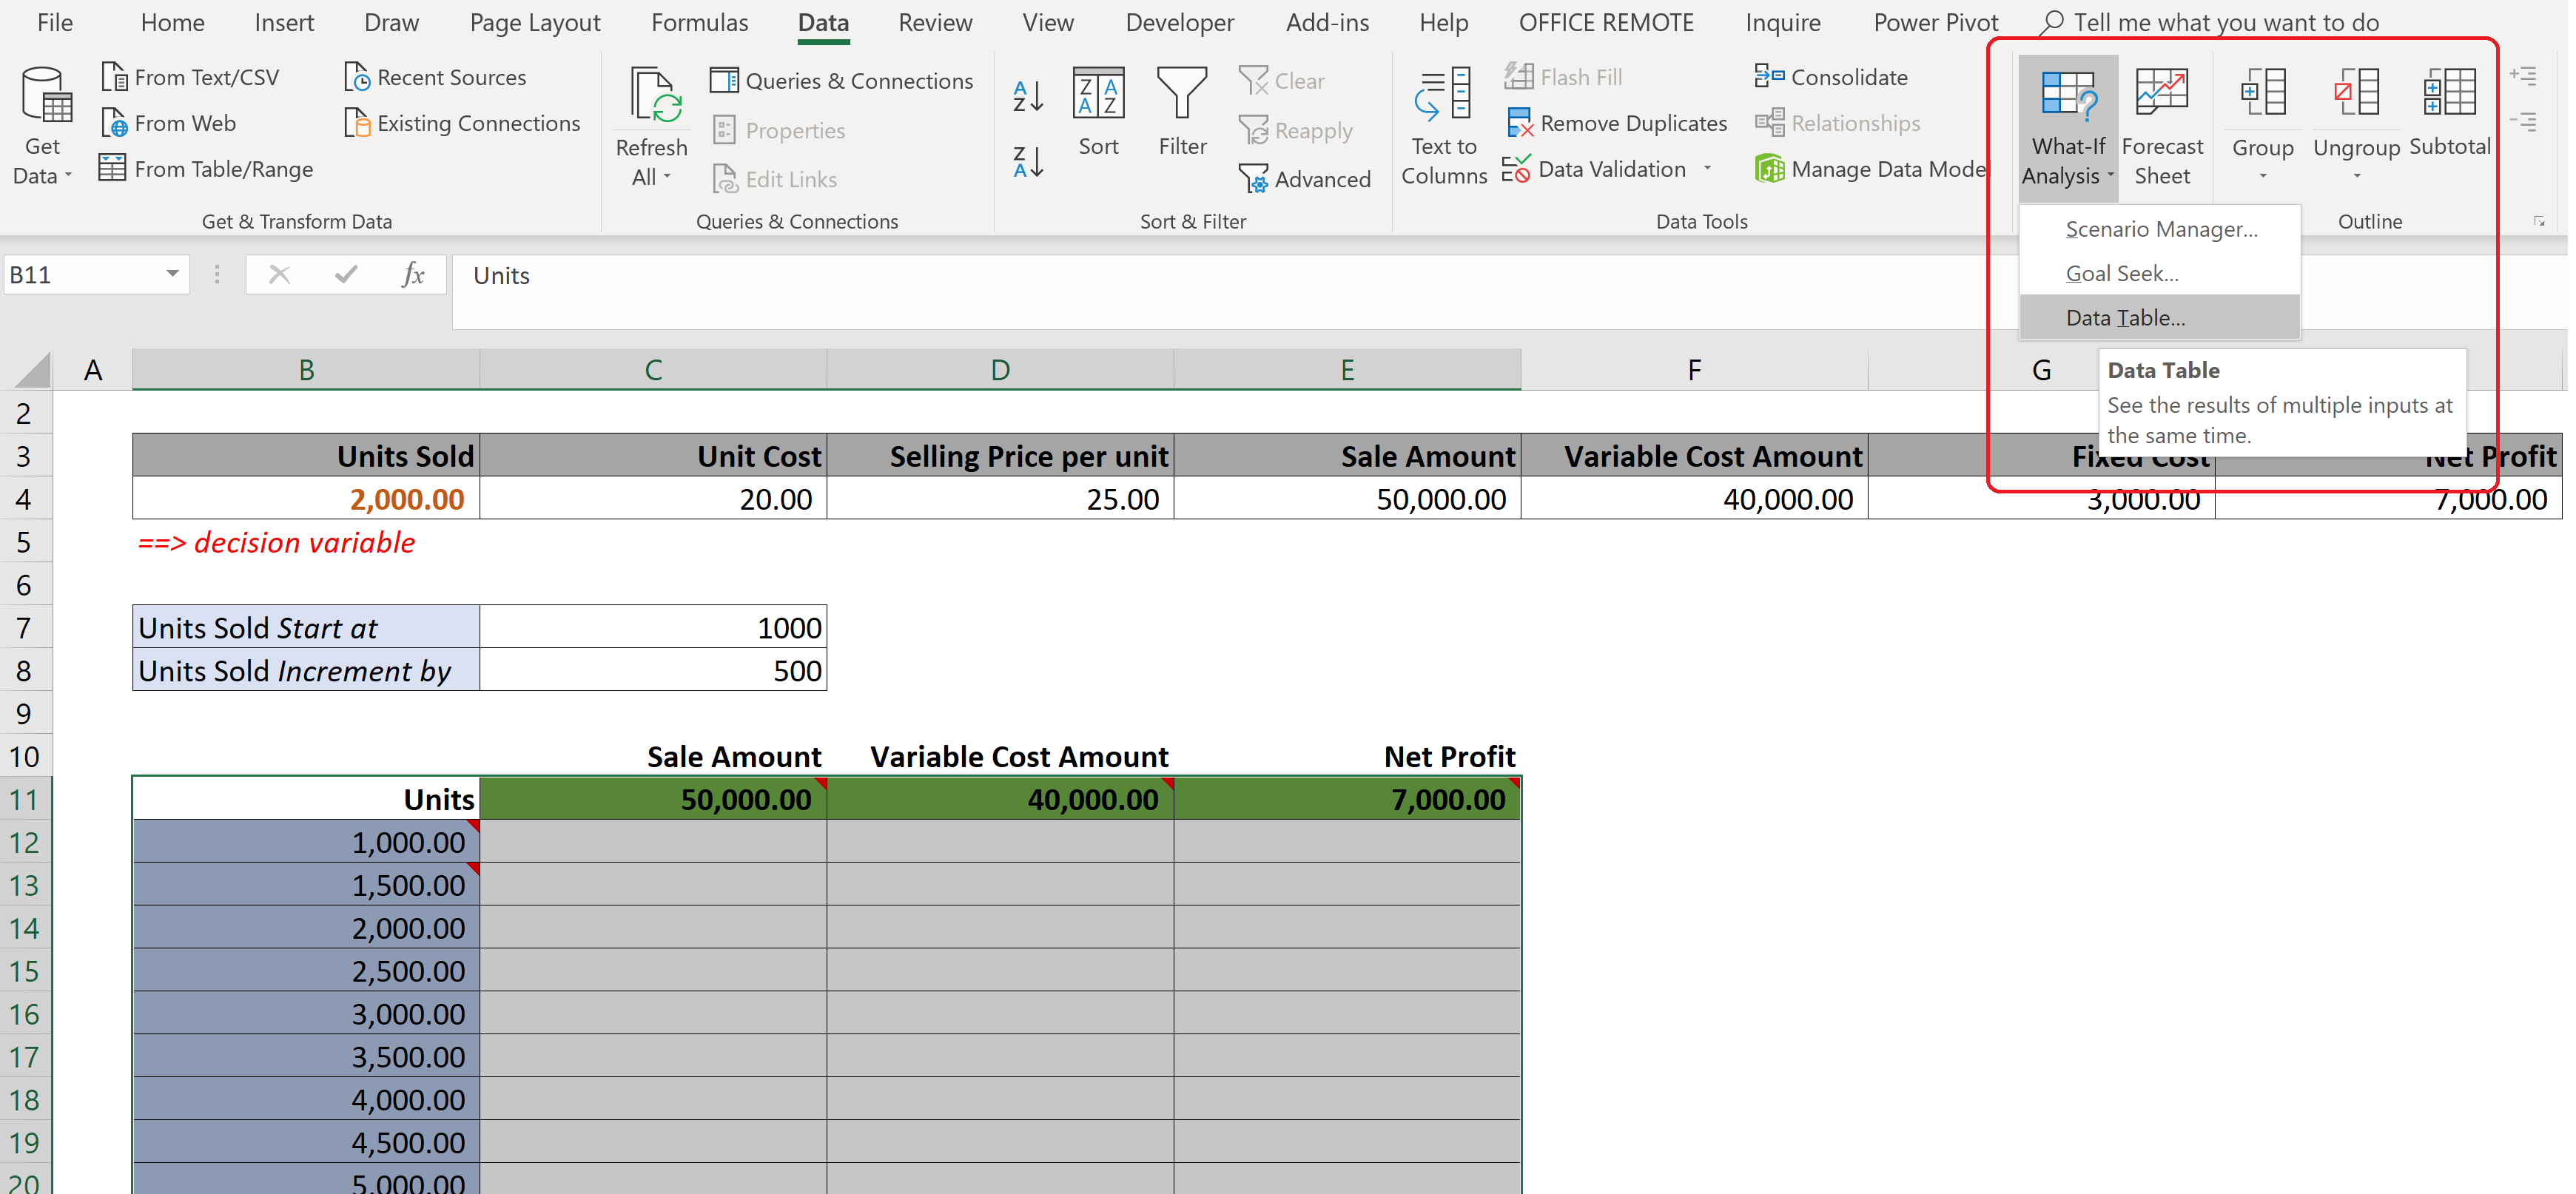
Select the entire matrix from cells B11:E20, and then go to Data Tab, Select What-If Analysis in the Forecast section, and then select option for Data Table.
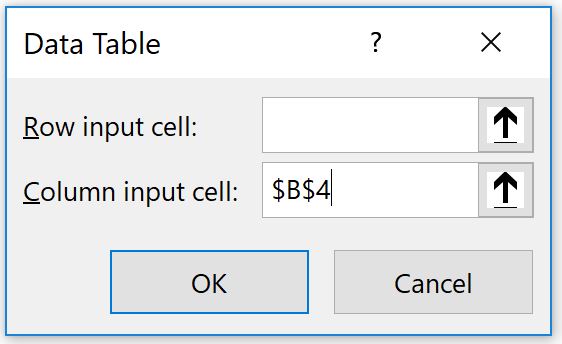
There are two arguments (1) Row Input Cell, and (2) Column Input Cell. These Data table arguments are not easily understood. So lets get a better understanding of these.
These two arguments can infact be mapped to the number of decision variables we are using for what-if analysis. In our example, since we are using only one decision variable i.e. “Units Sold”, hence we will need to input only one set of argument in the Data Table dialog box. This can be either Row or Column. Now, the question is which one should we choose.
This is where the color highlighting will help us. When we prepared our matrix, we have listed the range of values of “Units Sold” in the Blue area, which is infact a column range. This color coding will help us guide which Data Table argument to choose.
In our example, Row input cell will remain blank.
Column input cell: We will put in a reference to the decision variable from our original data set i.e. Cell Reference =$B$4.
Hit OK, and Voila. Our Data Table is ready, and Matrix is populated with all the possible outcomes for our range of Units Sold.
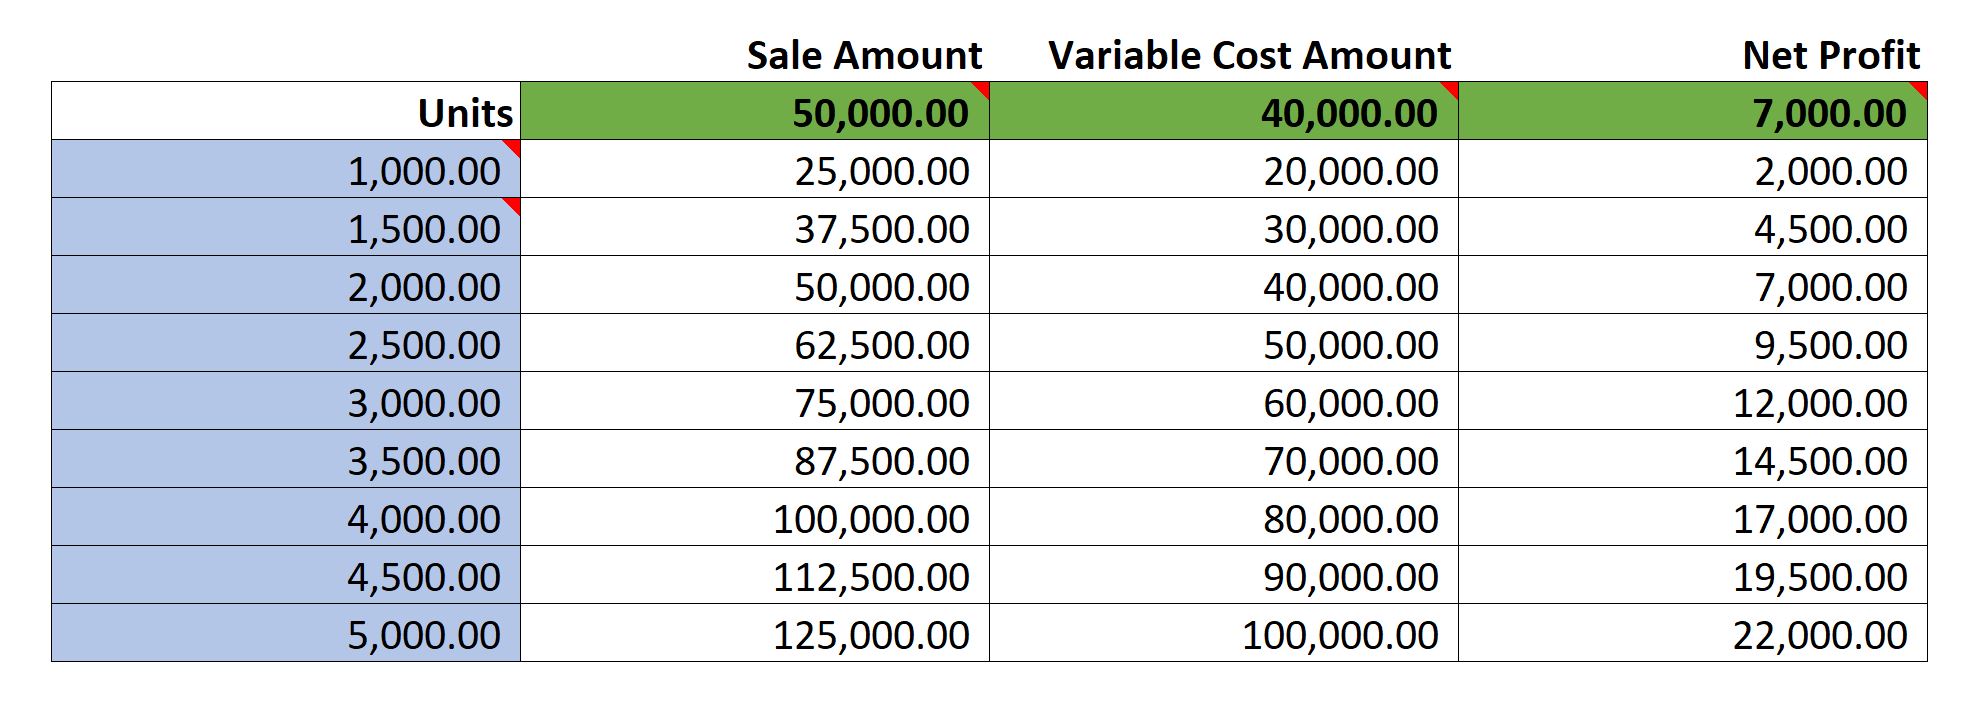
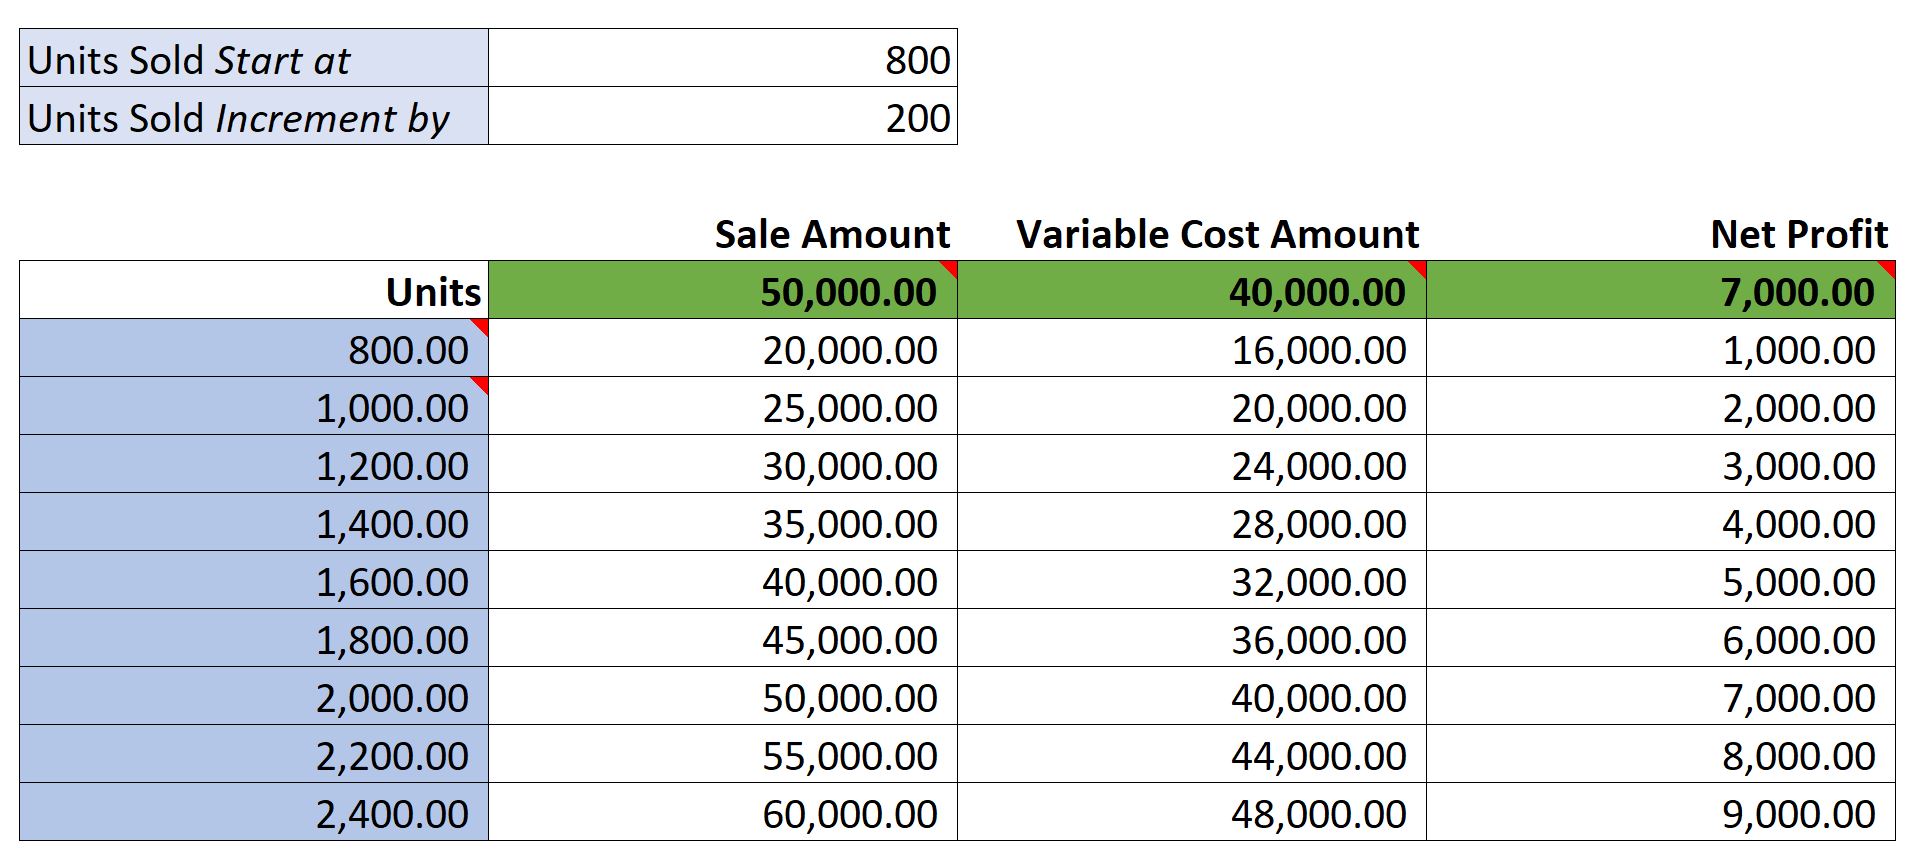
Coming back to Input Variable box that we had setup in Step 2 – so let’s discuss about that a bit. We had put in the following 2 arguments: “Units Sold Start at”, and “Units Sold Increment by”. Both provide additional flexibility in our Sensitivity analysis, where we can change these parameters any time, and see the Data Table refreshed based on our new set of range inputs for Units Sold.
For example, If I want to see the Units sold incremented by 200 units instead of 500, what will be the outcome. Vice Versa, If I needed to start the Units Sold at 800 Units and incremented by 200, what will be the outcome. Hope this is clear.
Two Variable Data Table What-If Analysis
Now continuing with the same example, suppose we wanted to see the outcome of Net Profit, based on two decision variables being “Units Sold”, as well as “Selling price per unit”.

Step 1
This time we will be setting up the Input Range, and Matrix as shown below.
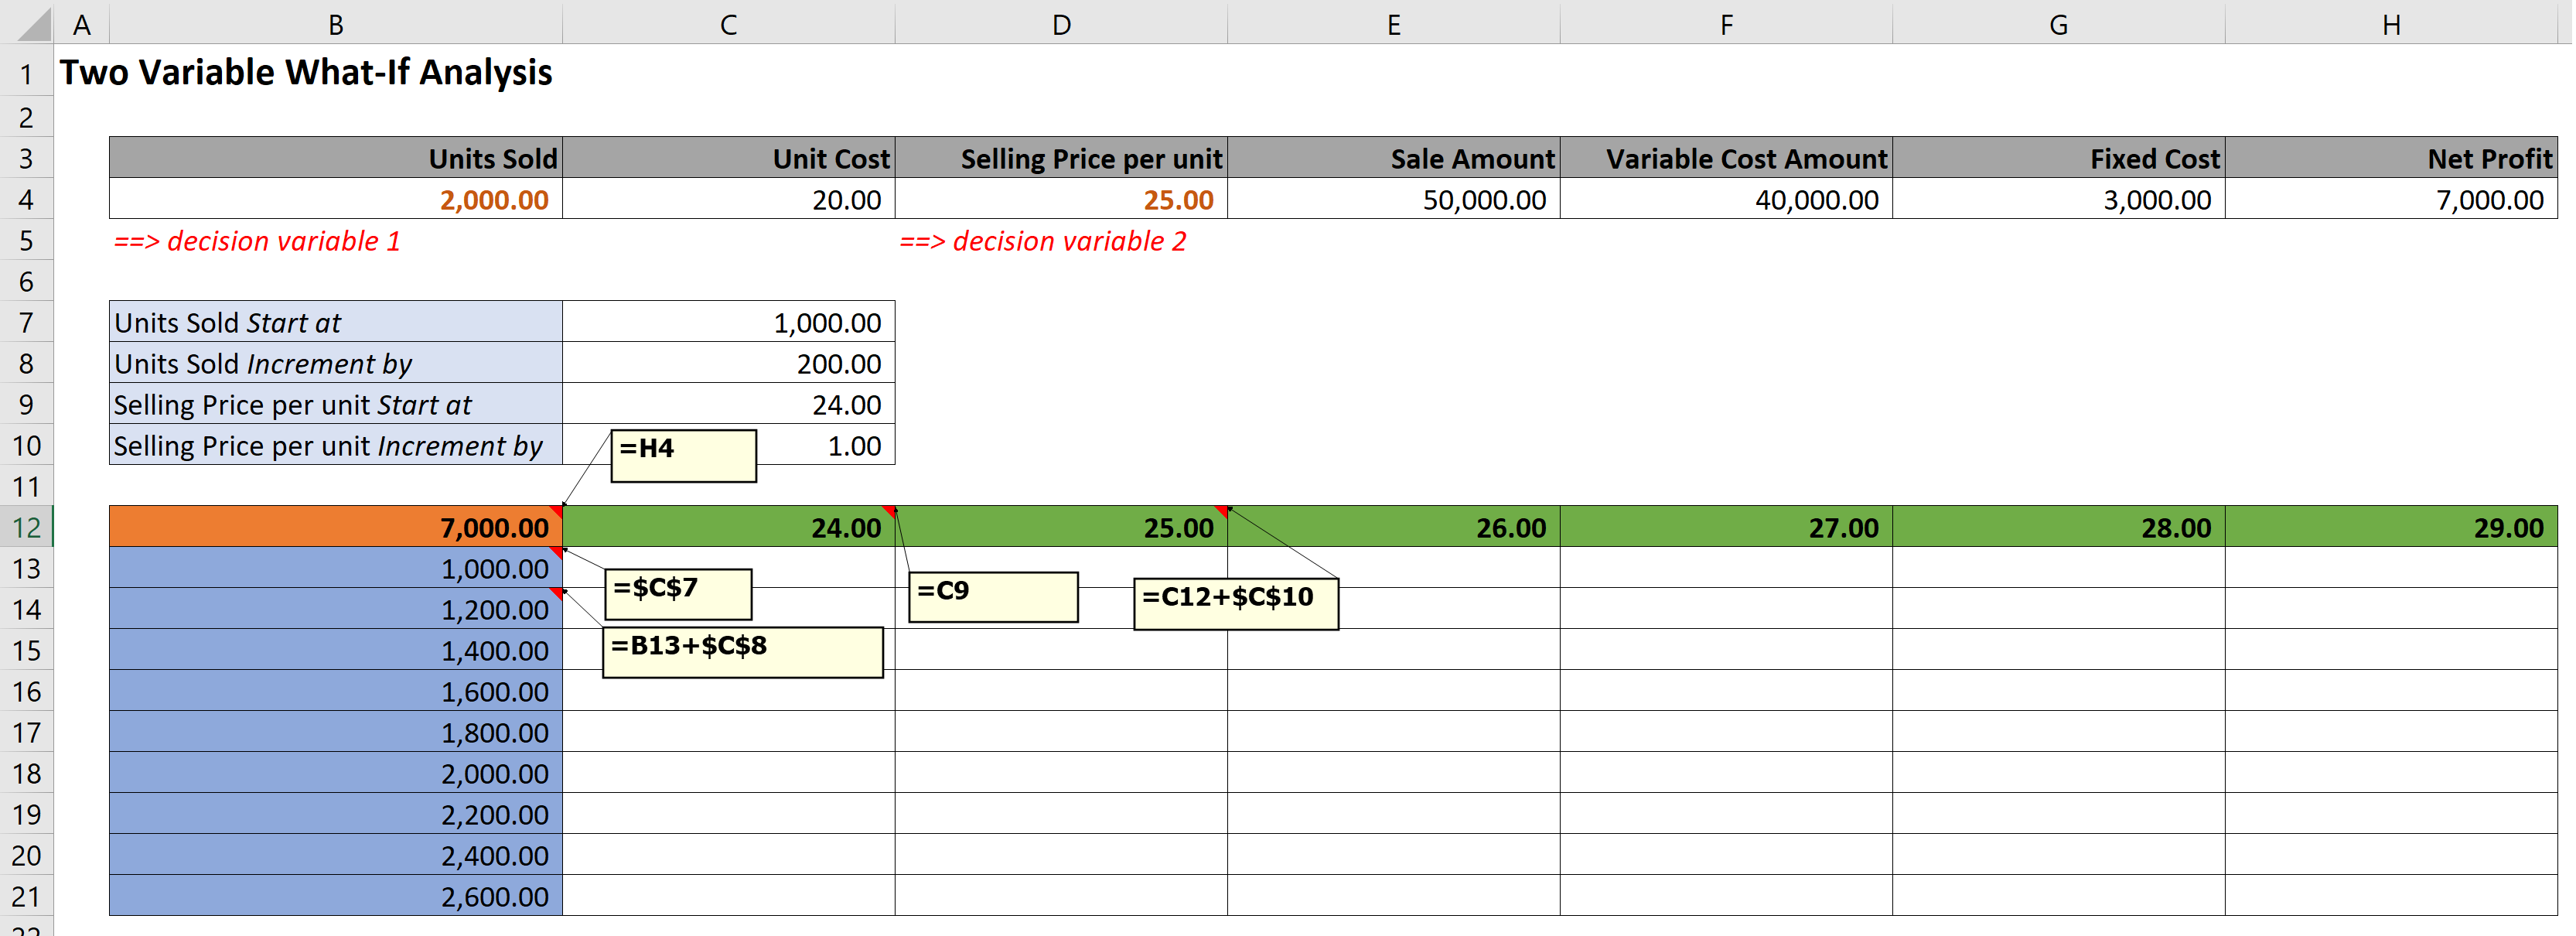
Remember, the Blue area (Column Area) is where “Units Sold” range of values are input. Green area (Row Area) is where the second decision variable – “Selling price per unit” range of values go. And the Amber highlighted cell is the outcome reference, for “Net Profit”.
Step 2
Select the entire matrix from cells B12:H21, and then go to Data Tab, Select What-If Analysis in the Forecast section, and then select option for Data Table.
When you get a “Data Table” dialog box, enter Data Table arguments as below.
In our example,
Row input cell: Cell Reference of second decision variable, =$D$4
Column input cell: Cell Reference of first decision variable, =$B$4
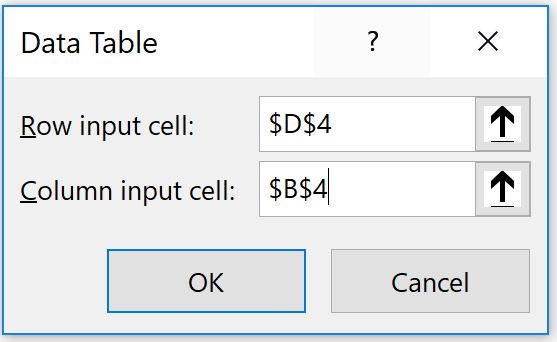
Hit OK, and our new Data Table is ready. The Matrix is populated with all the possible outcomes for our combination of range of Units Sold and Selling price per unit.

Bonus
How could we make use of the above in the form a dashboard. In the below example, I have created a dashboard like scenario selection, which a user will choose, and depending on the scenario chosen be it Optimistic, Most Likely, and Pessimistic, it will update the values in the input variable box. This in turn will drive the outcome data table.

You can download the example file from the link. Also, don’t forget to visit my YouTube channel for many more video tutorials. Happy Learning !!
